
Data
Eighteen datasets, one grid.
The tables behind every record, filterable and sortable in place. Save a filter and it becomes a list that re-runs itself every time you open it.

At a glance
Filtered on the server
Every filter runs against indexed columns, so the biggest table answers as fast as the smallest.
Act on a selection
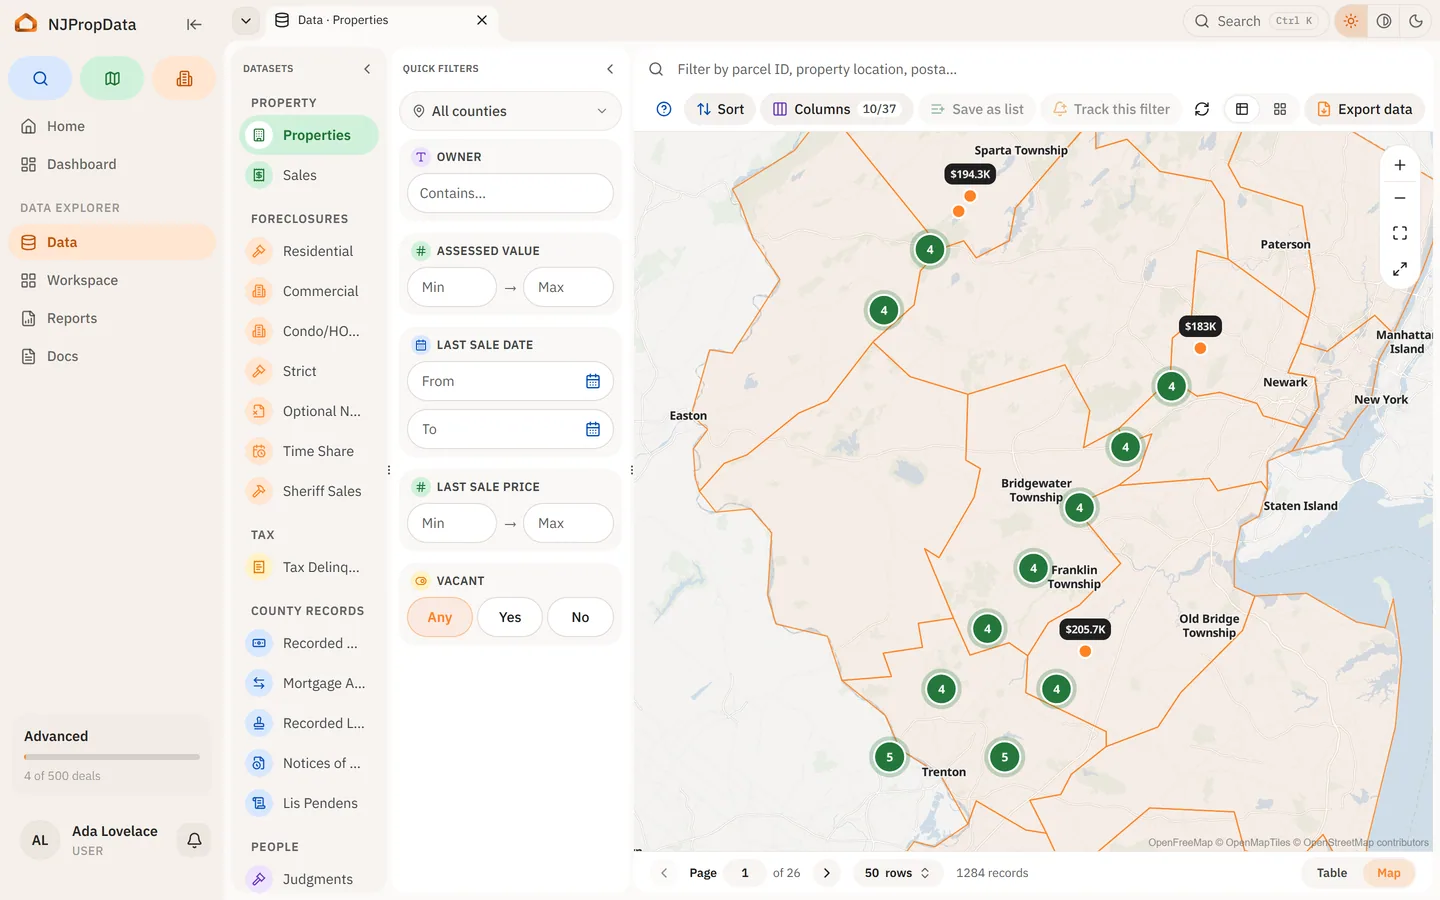
Open rows as a group, show them on the map, copy the pins, or export exactly what you picked.
A filter becomes a list
Save the filter, not the results: the list re-runs every time you open it, so it stays current.
Every view is a link
Dataset, filter, sort and the open record all live in the address bar, so what you built is what you send.
See it work
Narrow eight sample rows, then open the real grid.
The chips filter, the count follows, and the county scope is written into the address — the view you build is a link.
| Address | Class | Last sale | Assessment |
|---|---|---|---|
| Lincoln HighwayKearny, Hudson | Industrial | 2015 · $1,250,000 | $64,400 |
| 41 Ridge RoadHackensack, Bergen | Commercial | 2019 · $1,940,000 | $812,300 |
| 220 Broad StreetNewark, Essex | Commercial | 2021 · $3,100,000 | $1,420,000 |
| 18 Ocean AvenueLong Branch, Monmouth | Residential | 2017 · $612,000 | $486,900 |
| 7 Main StreetFreehold, Monmouth | Commercial | 2012 · $420,000 | $355,000 |
| 933 Route 9Toms River, Ocean | Vacant land | 2020 · $150,000 | $98,700 |
| 12 Highland AvenueJersey City, Hudson | Residential | 2016 · $545,000 | $401,500 |
| 65 Amboy AvenueEdison, Middlesex | Residential | 2014 · $340,000 | $298,400 |
This view, as a link/data
What you do here
01
Pick a dataset and narrow it
Filtering happens on the server against indexed columns, so a filter over eighteen million mortgages returns as fast as one over twelve thousand sheriff sales. Every column carries a field guide saying what it holds and where it came from.
02
Select rows and do something with them
Open them as a group, open each in its own tab, show them on the map, copy the pins, or export the selection. The map region draws whatever the filter currently returns.
03
Save the filter, not the results
A saved filter becomes a list that re-runs on open, so it stays current as records change. Point an alert at that list and you hear when its membership moves.
04
The URL is the state
The open dataset, the filter, the sort, the open record and the county scope all live in the address bar. A view you built is a link you can send.

What is in it
- Recorded mortgages
- 18,168,236
- Deed transfers
- 10,957,725
- Court docket filings
- 3,382,151
- Foreclosure cases
- 527,129
Measured September 7, 2026.
Who sees what
- Free
- The property table, view only.
- Pro
- Every other dataset, owner columns, advanced filters, saving a filter as a list, alerts on a saved list, and CSV downloads.
Related
- Property records
One record per parcel, assembled from every source that holds a piece of it.
- Map
Parcel boundaries, multi-select, and the record alongside the map.
- Alerts
Rules on properties and filters, delivered immediately or once a day.
Type an address.
Read the property record now. Pick a plan when you need the owner and what is filed against it.